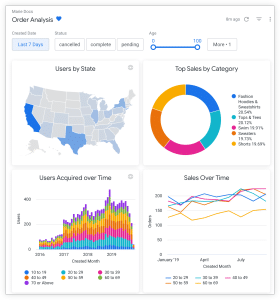
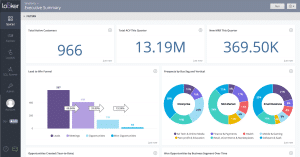
Welcome to an in-depth review of Looker Studio, Google’s powerful data visualization and business intelligence platform. Designed to help businesses make better data-driven decisions, Looker Studio enables users to connect, visualize, and explore data from a variety of sources. In this comprehensive 2024 tutorial, we’ll explore the ins and outs of Looker Studio, from setting it up to leveraging its advanced features with BigQuery, creating stunning dashboards, and understanding the benefits of upgrading to Looker Studio Pro.
What is Looker Studio and How Does It Work?
Introduction to Looker Studio
Looker Studio is a robust platform developed by Google as an extension of Google Data Studio. It provides a seamless experience for analytics and business intelligence practices. Designed to turn your data into actionable insights, Looker Studio supports complex queries and integrations with numerous data sources, ranging from SQL databases to cloud-based solutions like Google Cloud and BigQuery. Whether you are a data analyst or a business user, Looker Studio empowers you to create reports and dashboards that offer a clear picture of your business metrics.
Core Features of Looker Studio
The core features of Looker Studio revolve around its exceptional ability to visualize data efficiently. You can select from a range of charts and tables to represent your data, ensuring that you deliver the most impactful visuals. Looker Studio’s interactive dashboards allow users to drill down into specific data points and uncover deeper insights. Other key features include seamless integration with various data sources through connectors, data blending, and real-time data monitoring, making it a must-have tool for modern business intelligence.
Comparing Looker Studio Pro and Standard
While Looker Studio Standard offers robust capabilities, upgrading to Looker Studio Pro comes with advanced benefits. Looker Studio Pro includes enhanced visualization features, such as custom drilling paths and data actions, for more detailed analytics. The Pro version also provides advanced collaboration tools, allowing multiple users to simultaneously work on reports and dashboards within Google Workspace. With these additional features, businesses can maximize the power of their data and achieve more precise, actionable insights.
How to Visualize Your Data with Looker Studio?
Selecting the Right Charts and Tables
Selecting the appropriate charts and tables is crucial when you visualize your data in Looker Studio. The platform offers a wide variety of data visualization options, including bar charts, line charts, pie charts, geographical maps, and data tables. The choice of visualization depends on the type of analysis you aim to perform. For example, time-series data is best represented using line charts, whereas categorical comparisons might be better visualized using bar charts or pie charts.
Creating Interactive Dashboards
Interactive dashboards are one of the standout features of Looker Studio. These dashboards allow users to interact with data in real-time, providing a more engaging and insightful experience. You can set filters, apply date range controls, and create click-through links to dive deeper into specific metrics. This interactive element is particularly beneficial for presentations and real-time decision-making, enabling teams to explore data dynamically and uncover insights on the fly.
Customizing Your Looker Studio Report
One of the strengths of Looker Studio is its customizability. Users can tailor reports to meet specific needs, ensuring clarity and impact. You can adjust colors, fonts, and layouts to align with your brand’s identity. Embedding elements such as Google Ads data or additional widgets enhances the functionality of your Looker Studio report. Moreover, the platform supports a variety of templates, helping users to create professional reports quickly without sacrificing creativity or specificity.
How to Set Up and Integrate Data Sources in Looker Studio?
Connecting Google Data Studio to Looker Studio
Connecting Google Data Studio to Looker Studio is a straightforward process that opens doors to significant data analytics capabilities. This integration allows you to leverage existing reports and data, ensuring continuity and the ability to scale your analyses. To connect, you simply sign in with your Google credentials, authorize the connection, and sync your existing data sources – bringing your Google Analytics, Google Ads, and other data feeds into Looker Studio seamlessly.
Integrating with BigQuery and Other Data Sources
Integrating Looker Studio with BigQuery and other data sources is essential for harnessing comprehensive analytics. BigQuery serves as a powerful data warehouse solution that can store and handle vast amounts of data. Looker Studio uses partner connectors to link to BigQuery and virtually any kind of data repository. This integration allows for advanced data blending and querying, enabling users to derive more profound insights from diverse datasets.
Automating Data Updates
Automation is a significant advantage when using Looker Studio, particularly for real-time data monitoring. By scheduling automatic data updates, businesses can ensure that their dashboards and reports always reflect current metrics, without manual intervention. This process utilizes scripts and APIs to pull data at scheduled intervals, keeping your Looker Studio report continuously updated and ready for analysis.
What Are the Benefits of Upgrading to Looker Studio Pro?
Advanced Visualization Features
Upgrading to Looker Studio Pro introduces a suite of advanced visualization features designed for in-depth analytics. Users can unlock sophisticated visualizations such as Sankey diagrams and geo heat maps that are not available in the standard version. These advanced options allow for a richer exploration of data, uncovering insights that standard charts might obscure. By leveraging these features, businesses can better understand complex data relationships and trends.
Enhanced Collaboration Tools
Enhanced collaboration tools are another significant advantage of Looker Studio Pro. These tools enable multiple users to collaborate on reports and data in real-time within the Google Workspace environment. Features such as shared editing, live commenting, and version control streamline teamwork and ensure that everyone is on the same page. This collaborative approach facilitates faster decision-making and more informed business strategies.
Pro Tips for Maximizing Looker Studio Pro
To get the most out of Looker Studio Pro, consider applying these pro tips. First, utilize advanced data modeling to structure your data in a way that maximizes analytical potential. Second, take advantage of custom formulas and calculated fields to derive new metrics that drive insight. Lastly, embedding external content, like Google Analytics reports or third-party data, can significantly enrich the contextual depth of your dashboards. Leveraging these tips ensures that you are utilizing Looker Studio Pro to its fullest potential.
Need More Help with Looker Studio?
Step-by-Step Tutorials and Guides
For those new to Looker Studio or looking to expand their skills, step-by-step tutorials and guides are invaluable. These resources are available on Google’s official platforms and cover everything from basic report creation to advanced data integration techniques. They walk users through complex tasks in a digestible manner, empowering them with the knowledge to use Looker Studio efficiently.
Common Troubleshooting Tips
Encountering issues with Looker Studio is not uncommon, and understanding common troubleshooting tips can save time and frustration. Typical issues might involve connectivity problems with data sources, slow dashboard performance, or inaccuracies in data visualization. Solutions often include verifying data connections, optimizing queries, and ensuring that the data source configurations are correct. Google’s support forums and documentation are helpful resources for resolving these challenges.
Where to Find Additional Resources
Beyond the initial tutorials, additional resources for mastering Looker Studio can further enhance your skills. Google’s Looker Studio Help Center provides comprehensive guides, community forums, and best practice articles. Moreover, third-party educational platforms often offer specialized courses that dive deeper into specific aspects of Looker Studio. Joining professional communities on platforms like LinkedIn can also provide networking opportunities and insights from fellow users.
By following this comprehensive guide and utilizing the wealth of resources available, you can harness the full power of Looker Studio, transforming your data into meaningful, actionable insights for a successful 2024 and beyond.


